Fluidic Thrust Vector Control Using Shock Wave Concept
Copyright Ⓒ The Korean Society of Propulsion Engineers
This is an Open-Access article distributed under the terms of the Creative Commons Attribution Non-Commercial License(http://creativecommons.org/licenses/by-nc/3.0) which permits unrestricted non-commercial use, distribution, and reproduction in any medium, provided the original work is properly cited.
Abstract
Recently, fluidic thrust vector control has become a core technique to control multifarious air vehicles, such as supersonic aircraft and modern rockets. Fluidic thrust vector control using the shock vector concept has many advantages for achieving great vectoring performance, such as fast vectoring response, simple structure, and low weight. In this paper, computational fluid dynamics methods are used to study a three-dimensional rectangular supersonic nozzle with a slot injector. To evaluate the reliability and stability of computational methodology, the numerical results were validated with experimental data. The pressure distributions along the upper and lower nozzle walls in the symmetry plane showed an excellent match with the test results. Several numerical simulations were performed based on the shear stress transport(SST) k-ω turbulence model. The effect of the momentum flux ratio was investigated thoroughly, and the performance variations have been clearly illustrated.
초록
충격파 개념을 이용하는 유체 추력벡터 제어는 빠른 벡터링 응답, 간단한 구조 및 낮은 무게로 인하여 큰 벡터링 성능을 달성하는데 많은 이점을 제공한다. 본 논문에서는 전산유체역학 기법을 사용하여 슬롯 인젝터를 가진 3차원 직사각형 초음속 노즐에 대하여 연구를 수행하였다. 계산 방법론을 검증하기 위하여 수치 결과를 실험 데이터로 비교하였다. 대칭 평면에서의 상부 및 하부 노즐벽을 따르는 압력분포는 시험 결과와 잘 일치하였다. k-ω SST 난류모델을 기반으로 한 수치해석을 통하여, 운동량 플럭스 비율의 영향을 철저히 조사하여 추력의 성능 변화를 명확하게 나타내었다.
Keywords:
Fluidic Thrust Vector Control, Supersonic Flow, Shock Wave키워드:
유체 추력벡터제어, 초음속 유동, 충격파1. Introduction
Thrust vector control(TVC) as a traditionally high-end technique is not only furnishing forward thrust for air vehicles but also supplying supernumerary momentum for yawing, rolling, and pitching. Lately, fluidic thrust vector control(FTVC) is drawing researchers' attentions to manipulate the jet deflections of missiles, supersonic aircraft, and modern launch vehicle. As discussed by Herbst [1], FTVC would be one of the most priceless techniques in the immediate future. Henderson [2] demonstrated that the aircraft equipped with a FTVC system can take off or land at an aircraft carrier expediently. Many advantages were obtained from the FTVC technique, compared with traditionally mechanical TVC, such as more flexible maneuverability, faster dynamic response, lower weight and cost [3,4].
Lots of fluidic principles were considered to enrich investigations of FTVC, including dual throat nozzle TVC, co-flow TVC, counter-flow TVC, throat-skewing TVC, and shock vector control(SVC). Comparisons of different FTVC techniques are shown in Table 1.
In the last few years, some researchers had been investigated the SVC concept owing to its sample structure, high performance and less injected mass flow rate, compared with other fluidic techniques. As described by Zmijanovic et al. [5], stable performance in vacuum operating conditions for an axisymmetric conical supersonic nozzle equipped with a SVC system was proved. Spaid and Zukoski [6] experimentally investigated basic principles of the SVC with a finite span slot and argued that properties of boundary layer and injected penetration height can influence the magnitude of upstream separation region. Erdem et al. [7] experimentally studied that sonic round flows are injected into a high-speed cross-flow. The effect of pressure ratio on jet interaction dynamics was gained and jet penetration was reported to be a non-linear function on momentum flux ratio. 2D SVC performance was investigated experimentally and numerically by Mangin et al. [8] and Zou and Wang [9], then variations of deflection angle were illustrated. Deng et al. [10,11] discussed the SVC performance in 3D conical supersonic nozzles with cylindrical injectors and demonstrated effects of nozzle pressure ratio(NPR), injection location, and bypass flow rate on system performance. Waithe and Deere [12] conducted experimental investigations on SVC in a rectangular nozzle with a slot injector and offered some reliable data. Also, they demonstrated that the thrust vectoring angle decreases with increasing NPR value for a fixed secondary pressure ratio(SPR). Sellam et al. [13] conducted theoretical, experimental, and numerical analyses on SVC performance in an axisymmetric conical nozzle for different injected gases including air, argon, carbon dioxide, and helium as the mainstream was air. Although some researches for optimizing the SVC performance have been conducted during the last few years, some remaining problems need to be done by considering a 3D rectangular supersonic nozzle with a slot injector.
The subject of present simulations is to demonstrate more details on performance effects of momentum flux ratio. In order to consider the reliability and accuracy of present numerical methodology, accurate validation was carried out by comparing numerical results with experimental data.
2. Numerical Analysis
2.1 Basics of SVC
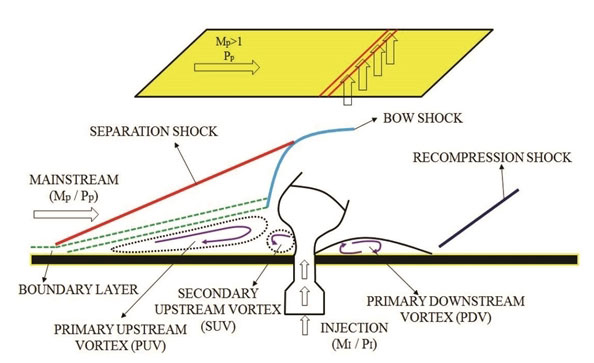
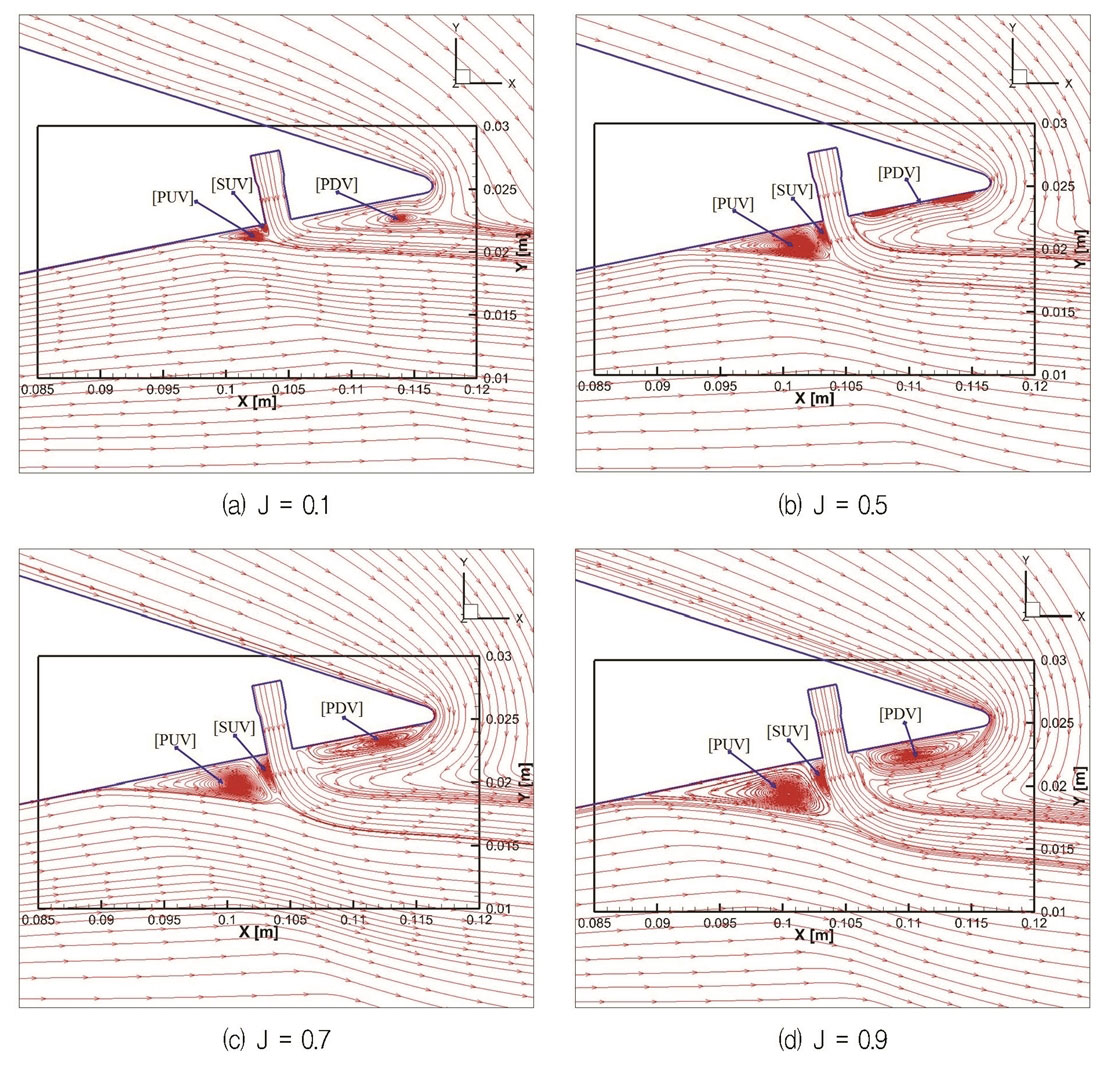
The schematic of 2D transverse slot injection model is depicted in Fig. 1. As the secondary flow is injected into a supersonic mainstream from the transverse, bow shock, boundary layer separations, and various viscous interactions will be induced. The turbulence boundary layer of mainstream separates at the upstream of injection port. At initial separation position, weak separation shock waves appear due to the adverse pressure gradient. The separation extent deepens while the boundary layer is close to the secondary flow. Thus, strong bow shock can take up. Two upstream regions filled with reverse vortexes can be observed and defined as primary upstream vortex(PUV) and secondary upstream vortex(SUV), respectively. A zone called by primary downstream vortex(PDV) is formed and shown in the figure. Initially, the separation shock breaks away from the oncoming flow. By crossing the separation zone, the mainstream attaches the strong bow shock and redirects rapidly. Therefore, jet deflections are induced by injected flow from the transverse.
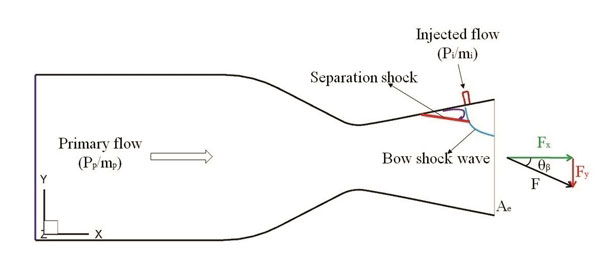
As the gas is injected into the divergent part of a supersonic nozzle, more considerations should be added in the case of high-speed freestream. Because the interaction between bounded mainstream and injected flow can cause more surface effects and complex shock reflections. The shock interaction, shock separation, and jet deflection in a convergent-divergent nozzle are shown in Fig. 2. The secondary flow in the boundary layer separation zone causes an unbalanced force acting on the nozzle exit plane. In order to evaluate the SVC performance precisely, effective assessment parameters should be defined.
Deflection angle is defined by the ratio of normal and axial forces acting on the nozzle exit plane Ae. The equation is expressed as follow
| (1) |
Where FN and FA mean normal and axial thrusts at the nozzle exit plane.
Thrust derives from two components including the momentum of accelerated fluid and an imbalance between nozzle exit pressure and ambient pressure, which consider entire effect of the separation region on nozzle exit plane.
| (2) |
| (3) |
Where mi and mp represent mass flow rates of secondary flow and mainstream, respectively. Aen and Aea are normal and axial components of the exit area, severally. Ven and Vea mean normal and axial components of the exit velocity, respectively. Pe represents the area-weighted average static pressure of the exit plane and Patm is the ambient pressure.
The resultant thrust coefficient is defined based on the ratio of practical and ideal thrusts.
| (4) |
| (5) |
| (6) |
| (7) |
Where subscripts p and s are referred to the mainstream and secondary flow, respectively. The subscript I represents the ideal state. FI,p and FI,s are ideal thrusts of mainstream and secondary flow, respectively.
Thrust efficiency is defined to illustrate the relationship between deflection angle and percentage of injected mass flow rate. It is a core parameter to demonstrate the SVC performance in terms of energy, which is given by
| (8) |
In addition, the momentum flux ratio is a core affecting factor for the SVC system, which should be considered specifically. The definition of momentum flux ratio (J) is given as
| (9) |
2.2 Computational procedure
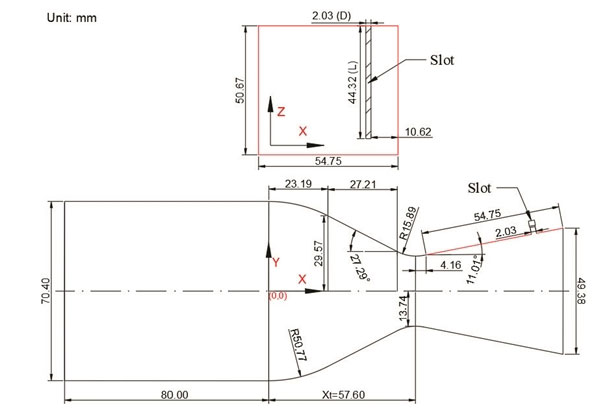
Experimental setups were established at NASA Langley Research Center and several experiments were conducted at static conditions in the Jet Exit Test Facility of the 16-Foot Transonic Tunnel Complex. The rectangular supersonic nozzle was installed in this test device. Detailed dimensions of this supersonic nozzle are shown in Fig. 3. The design NPR is 8.78 and throat area is 2785.16 mm2. The width of C-D nozzle is 101.34 mm. The distance from original point to nozzle throat along the X-axis is Xt = 57.60 mm. The injector type is set as a slot. The slot depth is 3 mm. The width and length of injection slot are 2.03 mm and 44.32 mm, respectively.
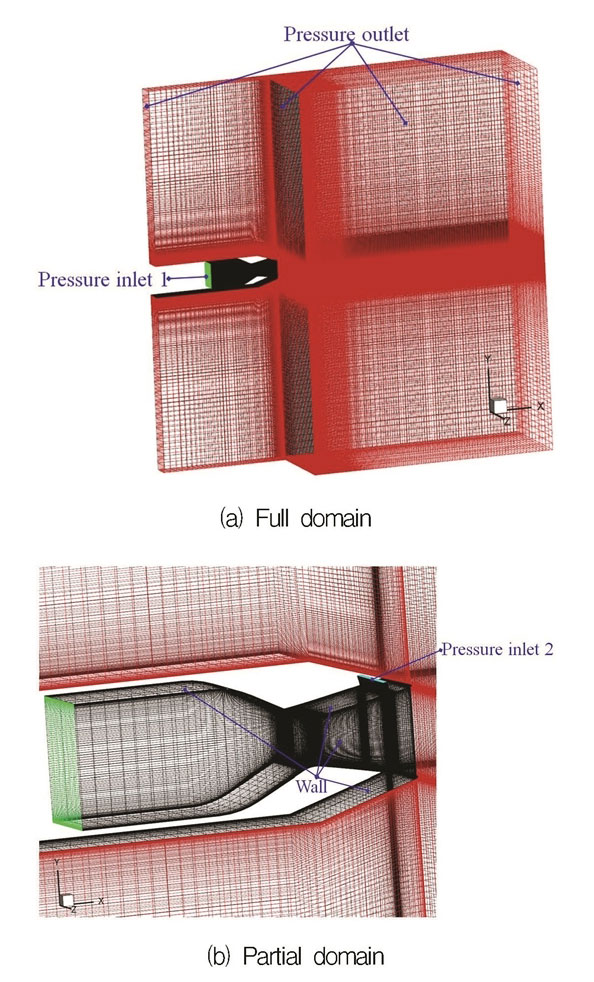
Half domain is made to carry out CFD work and detailed boundary conditions are described in Fig. 4. The computational domain extends 15 times of nozzle exit height along X-axis, 20 times of nozzle exit height along Y-axis and 10 times of nozzle exit height along Z-axis to realize adequate reliability and accuracy. The mainstream and secondary flow inlets were defined as pressure inlet. The exit boundaries of computational domain were set as pressure outlet (1 atm). The stagnation pressure (P0) of mainstream was set as 4.6 atm and the stagnation temperature (T0) was kept at 300 K.
ANSYS Fluent v 19.2 was used as the solver. The working fluid was air assumed as an ideal gas. Viscous flows were calculated by solving Navier-Stokes equations. Because of the importance of computational grids at the nozzle throat, injector inlet, and nozzle exit, pure structure grids were created and the high grid resolution was maintained at these positions as depicted in Fig. 4. The gradient grid resolution was kept along positive X, Y, and Z axes along the exit direction. In order to consider effects of the boundary layer developed along the nozzle wall, boundary layer meshes were established near the nozzle wall for computing viscous flows. Advection Upstream Splitting Method(AUSM) and second-order upwind schemes were set as the solution scheme.
3. Results and Discussions
3.1 Validation
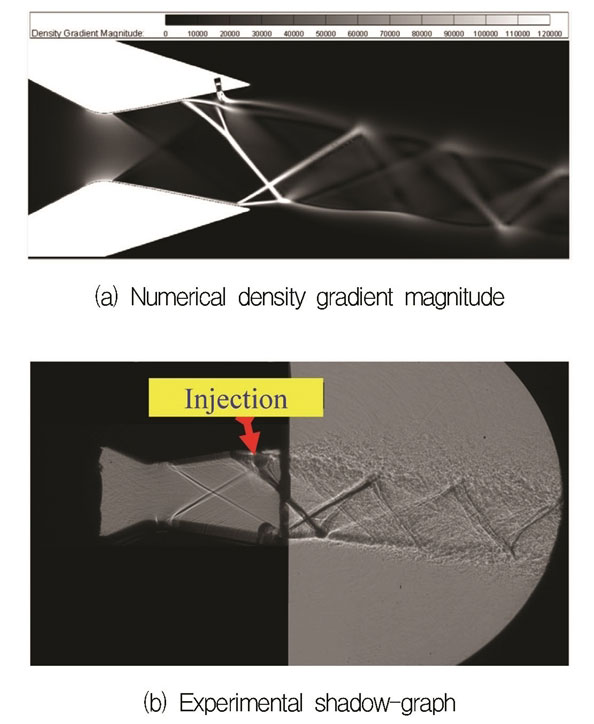
To validate the reliability and accuracy of present methodology, the comparison between experimental and CFD results was done. Normalized pressure distributions along the upper and lower nozzle walls between experimental and CFD results at NPR = 4.6 and J = 0.7 are shown in Fig. 5. It was evident that the SST k-ω turbulence model gives excellent predictions in agreement with experimental results. Therefore, the SST k-ω turbulence model was selected for further numerical simulations. In Fig. 6, the density gradient magnitude is plotted from numerical simulation and compared with experimental shadow-graph. The quantitative and qualitative validations indicate present methodology can reveal the SVC performance precisely.
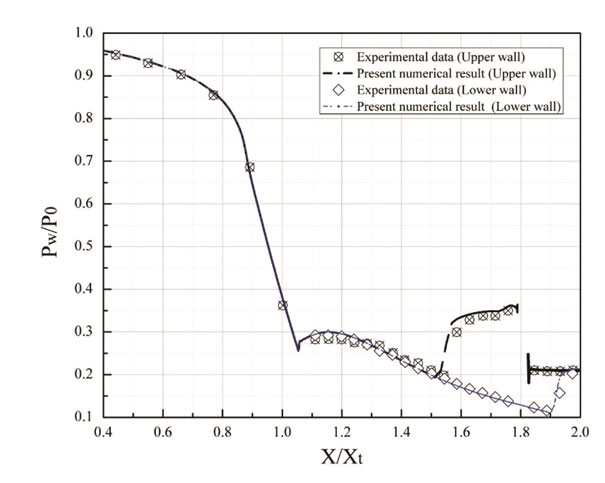
Comparison of pressure distributions along the upper and lower nozzle walls between experimental data and CFD results.
3.2 Grid independence analysis
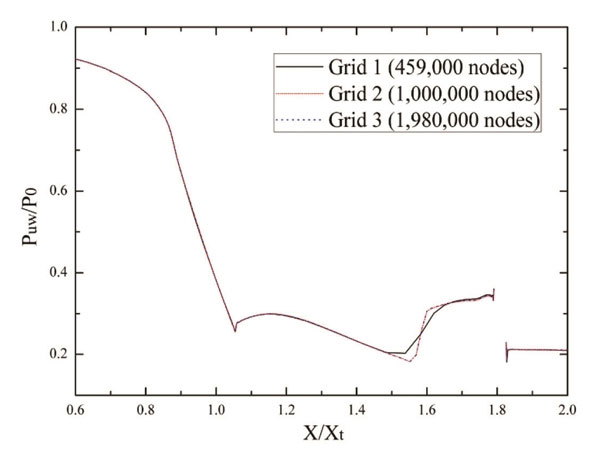
A grid independence analysis was conducted based on three different resolutions that include 0.459 million nodes, 1.98 million nodes, and 4.02 million nodes. The comparison of pressure distributions along the upper nozzle wall in the symmetry plane at three meshes is done and a most appropriate resolution in present numerical simulations is shown in Fig. 7. The static pressure of grid 1 shows a significant difference with grid 2 and grid 3, whereas the difference between grid 2 and grid 3 is quite small. Hence, the grid 2 with 1 million nodes is adequate for present simulations.
3.3 Effect of the momentum flux ratio
The SVC performance is studied to optimize vector effectiveness by changing the momentum flux ratio. Four different momentum flux ratios (J = 0.1, 0.5, 0.7, and 0.9) are illustrated clearly. In these cases, the NPR is kept constant at 4.6 and stagnation temperature is set as 300 K.
Static pressure distributions along the upper nozzle walls in the symmetry plane are discussed in Fig 8. In Fig. 9, the pressure distributions along the upper and lower nozzle walls in the symmetry plane at NPR = 4.6 and J = 0.7 are divided into several regions to give a detailed explanation. In Fig. 9, the rapid pressure growth is gained in region (1) because of the separation of turbulent boundary layer. Then, the pressure increases smoothly in region (2) due to the influence of PUV. In region (3), the static pressure increases to the peak value followed by a decrease until the injector port, which is caused by the SUV. In region (4), the relative constant pressure level is observed due to the existence of PDV. Focusing on the pressure distribution along the lower nozzle wall in the symmetry plane, a rapid pressure growth is obtained owing to the boundary layer separation on the lower nozzle wall. Combined with streamlines depicted in Fig. 10, the reasons of pressure variation are illustrated clearly. Some overlapping pressure distributions at various momentum flux ratios are owing to the submissive isentropic processes. Considering the changing part of pressure distribution, the starting point showing steep pressure growth is corresponding to the position of boundary layer separation. Furthermore, the separation point moves upstream with the increase of momentum flux ratio. In addition, the static pressure rises to a peak value followed by a decrease. A higher peak value can be obtained with the increase of momentum flux ratio, because of the increase of SUV. A close insight reveals that the area of PDV region has some changes by varying the momentum flux ratio. The PDV area increases with the increasing momentum flux ratio.
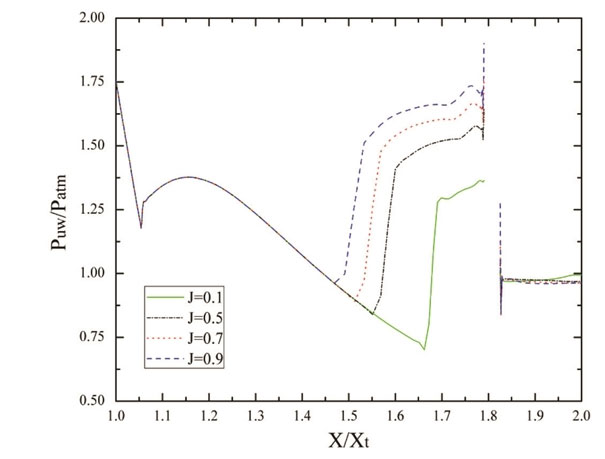
Static pressure distributions along the upper nozzle wall in the symmetry plane at different momentum flux ratios.
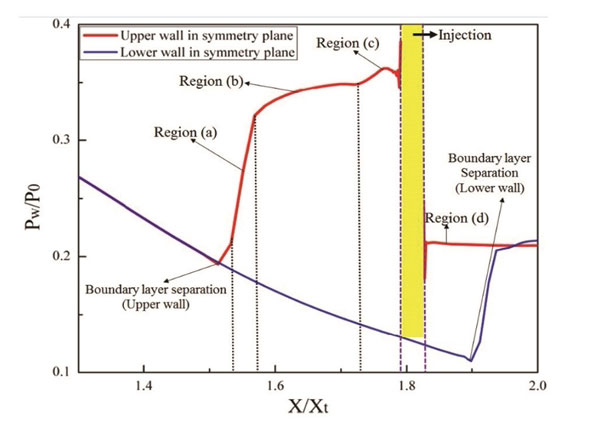
Schematic diagram of static pressure distributions along the upper and lower nozzle walls in the symmetry plane (NPR = 4.6, J = 0.7).
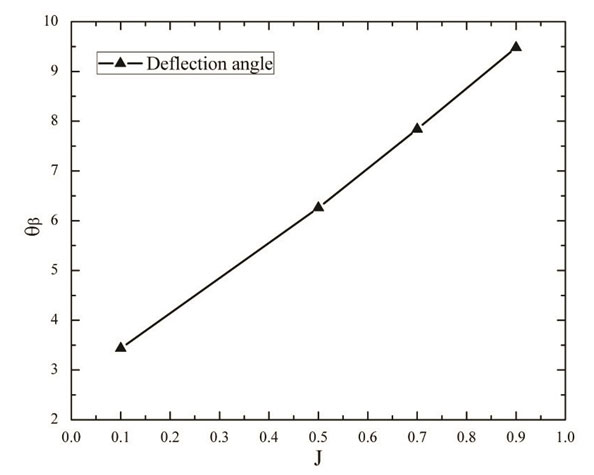
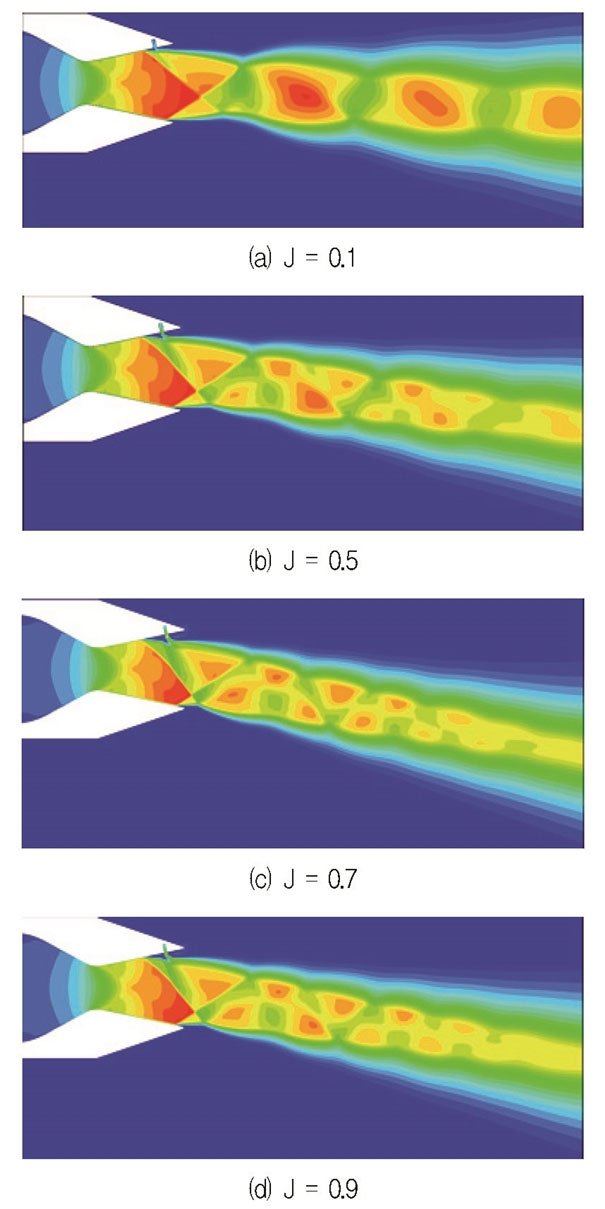
The deflection angle of SVC system is shown in Fig. 11. Various momentum flux ratios are controlled by adjusting the control valve. The thrust vector angle increases rapidly with the increasing momentum flux ratio. Because the increase of momentum flux ratio from the injector can result in a stronger bow shock that squeezes the mainstream more powerfully to cause a larger jet deflection. Fig. 12 shows several Mach number contours by changing the momentum flux ratio which reveal more details of the flow-field natures. It can be qualitatively observed that the deflection angle increases with the increasing momentum flux ratio as calculated quantitatively. In addition, there are some variations in the shape of shock wave at different momentum flux ratios. Specifically, the shock structure for J = 0.10 differs from those under other momentum flux ratios.
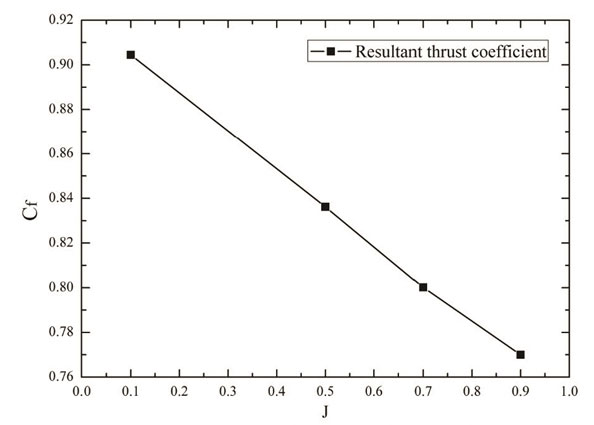
Resultant thrust coefficients at different momentum flux ratios are depicted in Fig. 13. The resultant thrust coefficient decreases linearly with the increase of the momentum flux ratio. The ideal mainstream thrust is kept constant due to the constant NPR value based on Eq. 6. Meanwhile, the ideal thrust of secondary flow increases with increasing momentum flux ratio based on Eq. 7. Thus, the ideal resultant thrust increases. Moreover, the real resultant thrust diminishes with the increasing momentum flux ratio, which can result in the decreasing resultant thrust coefficient.
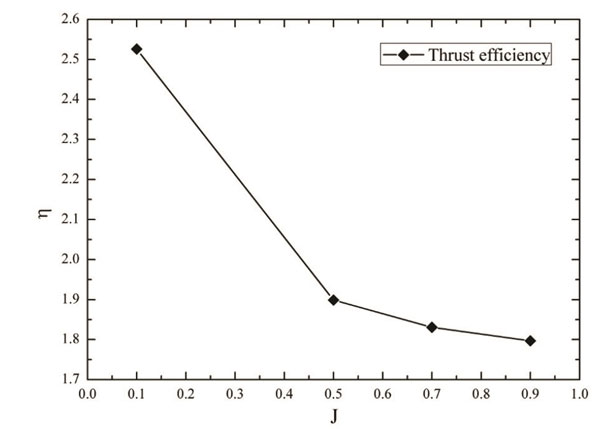
A series of thrust efficiencies at different momentum flux ratios are shown in Fig. 14. The thrust efficiency decreases with increasing momentum flux ratio. Specifically, a steep decrease is obtained from J = 0.1 to J = 0.5, whereas a smooth diminution is gained from J = 0.5 to J = 0.9. Based on Eq. 8, it can be known that the thrust efficiency is calculated by considering the relationship between deflection angle and secondary mass flow ratio. Although a linear variation of deflection angle is obtained by changing the momentum flux ratio, a non-linear secondary flow ratio results in a non-linear variation of thrust efficiency.
4. Conclusions
Fluidic thrust vector control using shock wave was studied and the effect of momentum flux ratio on SVC performance was illustrated. Core performance parameters were obtained, such as pressure distributions along the upper and lower nozzle walls in the symmetry plane, deflection angle, resultant thrust coefficient, and thrust efficiency. Present CFD results were compared with the experimental data to validate the reliability of computational methodology. It was evident that there is a great agreement between numerical and experimental studies. Some important conclusions from present study are illustrated as follows.
The momentum flux ratio has a significant impact on the SVC performance. The boundary layer separation location moves upstream with the increasing momentum flux ratio. The deflection angle is found to be increased linearly as the momentum flux ratio increases. The resultant thrust coefficient decreases linearly with increasing momentum flux ratio, whereas the thrust efficiency diminishes non-linearly.
Nomenclature
| Ae : | nozzle exit area |
| Aea : | axial component of the nozzle exit area |
| Aen : | normal component of the nozzle exit area |
| Cf : | resultant thrust coefficient |
| FI : | ideal thrust |
| FI,s : | ideal thrust of secondary flow |
| FI,p : | ideal thrust of mainstream |
| FA : | axial thrust |
| FN : | normal thrust |
| J : | momentum flux ratio |
| Mp : | Mach number of mainstream |
| Ms : | Mach number of secondary flow |
| mp : | mass flow rate of mainstream |
| ms : | mass flow rate of secondary flow |
| P0 : | stagnation pressure |
| Patm : | ambient pressure |
| Pe : | area-weighted average static pressure of the nozzle exit |
| Pw : | static pressure along the nozzle wall |
| Plw : | static pressure along lower nozzle wall |
| Puw : | static pressure along upper nozzle wall |
| pp : | static pressure of mainstream |
| ps : | static pressure of secondary flow |
| R : | gas constant |
| T : | temperature |
| T0 : | stagnation temperature |
| Ve : | velocity at the nozzle exit |
| Vea : | axial component of the nozzle exit velocity |
| Ven : | normal component of the nozzle exit velocity |
| v : | velocity |
| γ : | specific heat ratio |
| η : | thrust efficiency |
| θβ : | deflection angle |
| NPR : | nozzle pressure ratio, NPR = P0/Patm |
| SPR : | secondary pressure ratio, SPR = Pi/Patm |
Acknowledgments
이 논문은 한국추진공학회 2018년도 추계학술대회(2018. 12. 19-21, 웨스틴 조선호텔 부산) 발표논문을 심사하여 수정·보완한 것임.
This work was supported by the National Research Foundation of Korea(NRF) grant funded by the Korea government(MSIP) (No. NRF-2016R1A2B3016436).
References
-
Herbst, W.B., “Future Fighter Technologies“, Journal of Aircraft, 17(8), p561-566, (1980).
[https://doi.org/10.2514/3.44674]

- Henderson, W.P., “Propulsion System Integration in High Performance Aircraft“, Journal of Aerospace Engineering, 10, p21-25, (1990).
-
Mason, M.S., and Crowther, W.J., “Fluidic Thrust Vectoring for Low Observable Air Vehicles“, 2nd AIAA Flow Control Conference, Portland, O.R., USA, AIAA 2007-5084 Jun. 2004.
[https://doi.org/10.2514/6.2004-2210]

-
Wilde, P.I.A., Crowther, W.J., Buonanno, A., and Savvaris, A., “Aircraft Control Using Fluidic Maneuver Effectors“, 26th AIAA Applied Aerodynamics Conference, Honolulu, H.A., USA, AIAA 2008-6406 Aug. 2008.
[https://doi.org/10.2514/6.2008-6406]

-
Zmijanovic, V., Lago, V., and Chpoun, A., “Thrust Shock Vector Control of an Axisymmetric Conical Supersonic Nozzle via Secondary Transverse Gas Injection“, Shock Waves, 24(1), p92-111, (2014).
[https://doi.org/10.1007/s00193-013-0479-y]

-
Erdem, E., and Kontis, K., “Numerical and Experimental Investigation of Transverse Injection Flows“, Shock Waves, 20(2), p103-118, (2010).
[https://doi.org/10.1007/s00193-010-0247-1]

-
Spaid, F.W., and Zukoski, E.E., “Study of the Interaction of Gaseous Jets from Transverse Slots with Supersonic External Flows“, AIAA Journal, 6(2), p205-212, (1968).
[https://doi.org/10.2514/3.4479]

-
Mangin, B., Chpoun, A., and Jacquin, L., “Experimental and Numerical Study of the Fluidic Thrust Vectoring of a Two-Dimensional Supersonic Nozzle“, 24th AIAA Applied Aerodynamics Conference, Fluid Dynamics and Co-located Conferences, San Francisco, C.A., USA, AIAA 2006-3666 Jun. 2006.
[https://doi.org/10.2514/6.2006-3666]

- Zou, X.H., and Wang, Q., “The Comparative Analysis of Two Typical Fluidic Thrust Vectoring Exhaust Nozzles on Aerodynamic Characteristics“, International Journal of Aerospace and Mechanical Engineering, 5(4), p827-833, (2011).
-
Deng, R.Y., Kong, F.S., and Kim, H.D., “Numerical Simulation of Fluidic Thrust Vectoring in an Axisymmetric Supersonic Nozzle“, Journal of Mechanical Science and Technology, 28(12), p4979-4987, (2014).
[https://doi.org/10.1007/s12206-014-1119-x]

-
Deng, R.Y., and Kim, H.D., “A Study on the Thrust Vector Control Using a Bypass Flow Passage“, Proceeding of the Institution of Mechanical Engineers, Part G: Journal of Aerospace Engineering, 229(9), p1722-1729, (2015).
[https://doi.org/10.1177/0954410014558693]

- Waithe, K.A., and Deere, K.A., “Experimental and Computational Investigations of Multiple Injection Ports in a Convergent-Divergent Nozzle for Fluidic Thrust Vectoring“, AIAA Applied Aerodynamics Conference, Orlando. F.L., USA, AIAA 2003-3802 Jun. 2003.
-
Sellam, M., Vladeta, Z., Leger, L., and Chpoun, A., “Assessment of Gas Thermodynamic Characteristics on Fluidic Thrust Vectoring Performance: Analytical, Experimental and Numerical Study“, International Journal of Heat and Fluid Flow, 53, p156-166, (2015).
[https://doi.org/10.1016/j.ijheatfluidflow.2015.03.005]


