Applications of Dynamic Mode Decomposition to Unstable Shock-Induced Combustion
Copyright Ⓒ The Korean Society of Propulsion Engineers
This is an Open-Access article distributed under the terms of the Creative Commons Attribution Non-Commercial License(http://creativecommons.org/licenses/by-nc/3.0) which permits unrestricted non-commercial use, distribution, and reproduction in any medium, provided the original work is properly cited.
Abstract
Dynamic mode decomposition (DMD) method was applied for the further study of periodical characteristics of the unsteady shock-induced combustion. The case of Lehr’s experiments was numerically simulated using 4 levels of grids. FFT result reveals that almost all the grid systems oscillate at frequencies around 430-435 kHz and the measureed one is around 425 kHz. To identify more resonant modes with low frequencies, DMD method is adopted for 4 grid systems. Several major frequencies are extracted and their damping coefficients are calculated at the same time, which is a quantification parameter for combustion stabilization.
초록
비정상 충격파 유도연소의 주기적 압력 진동 특성을 연구하기 위하여 DMD 방법을 적용하였다. Lehr의 충격파 유도 연소 실험을 기반으로 수치적인 연구를 수행하였다. Lehr의 실험을 4 수준의 격자를 이용하여 수치적으로 모사하였으며, FFT 결과로부터 430-435 kHz의 주파수가 계산되었다. 실험 결과는 약 425 kHz로 해석 결과와 유사한 것을 확인하였다. FFT 해석에서 도출되지 않은 저주파 특성을 파악하기 위해 dynamic mode decomposition (DMD) 방법을 적용하였다. 여러 가지 모드 주파수가 계산되었고, 연소불안정 평가 인자 중 하나인 damping coefficient를 도출하여 안정/불안정성을 평가하였다.
Keywords:
Shock-Induced Combustion, SIC, Combustion Instability, Dynamic Mode Decomposition, DMD키워드:
충격파 유도 연소, 연소 불안정, 동적 모드 분해1. Introduction
Shock-Induced Combustion (SIC) is a phenomenon in which the leading shock compresses the combustible mixture behind the shock wave and the aerodynamically compressed combustible mixture self-ignites at high temperature and pressure. Close coupling of gas dynamics and reaction front triggers the chemical instabilities and hence numerical investigation on SIC flows is crucial to understand such complex theoretical phenomena. Ballistics experiments showed that there exists a close coupling between supersonic fluid dynamics and non-equilibrium chemical kinetics. The region between the shock wave and energy release zone is called as the induction zone and it is because of the ignition delay caused by the chemical non-equilibrium. Depending on the energy release rate, the flow can be categorized into various modes. When the energy release rate is quite high, the shock front and the reaction front couple each other and exhibits a steady mode. When the energy release rate is slightly less when the Mach number is around Chapman-Jouguet (C-J) detonation speed, the shock front and the reaction front decouple each other and exhibits an unsteady mode, as observed in Lehr’s Experiment[1].
Lehr conducted ballistic experiments and reports various modes of SIC. McVey and Toong[2] experimentally proposed a model to explain the oscillation mechanism in Regular Regime (RR), where the projectile oscillates in a regular manner, using a simple x-t graph along the stagnation streamline. They proposed that RR consists of the following: A compression wave created at the new reaction regime travels towards the bow shock wave and creates a contact discontinuity after interacting. In general, the temperature in the region ahead of the contact discontinuity through the bow shock is higher than the other region and hence have a shorter induction region. Hence a new reaction front occurs in front of the original reaction front and this cycle is periodically repeated. Similarly, Large Disturbance Regime (LDR) in Shock-Induced Combustion, where the projectile does not oscillate in a regular mode, were explained by Matsuo et al.[3] with the help of simple two step model and validated with detailed kinetic mechanisms and later validated the mechanisms with a Jachimowski reaction mechanisms. Choi et al.[4-5] studied the unsteady flow field with different grids and numerical methods to investigate the effect of numerical resolution on the prediction of the unsteady SIC.
The unstable characteristics of SIC has been typically studied by one-dimensional analysis of wave interactions along the stagnation line, that was insufficient to understand the multidimensional characteristics of the instability. In the present study, the unstable nature of the SIC has been studied further by using dynamic mode decomposition (DMD) method for the better understanding of the periodically unstable SIC flow field.
DMD is a post-processing tool to get a specific unsteady flow field with a monochromatic frequency of interest. To determine the wide range of frequencies of interest, this post-processing tool is adopted and the results are compared with FFT analysis in order to identify unstable modes more clearly.
2. Numerical methods
2.1 Governing Equations and Numerical Methods
Ignition and combustion in SIC mainly governed by the shock compression and the effect of transport properties is known to be negligible. Therefore, species conservation equations and inviscid Euler equations for compressible flow are used as governing equations of the reacting flow around an axisymmetric blunt body with ideal gas equation of state. The coupled conservation equations for N number of species is written in curvilinear coordinate form as follows:
| (1) |
where
Here, u and v are the velocity components in Cartesian coordinates, x and y. And, ξx, ξy, ηx, and ηy are coordinate transformation parameters. U and V are contra-variant velocity components in the generalized coordinates, respectively. Total energy per unit volume e is defined as a sum of kinetic energy and internal energy. Detailed information on how these values are evaluated are provided in the previous works[4,5].
The symbols adopted in Eq. 1 are conventional ones and their description is omitted here. The governing equations are discretized by a fully implicit finite volume method scheme, providing second order time accurate and third order spatial accuracy. Numerical flux of the convective terms are formulated calculated using AUSMDV scheme with third order WENO (Weighted Essenstially Non- Oscillatory) for the interpolation of primitive variables at cell interfaces. Newton sub-iteration method is used to ensure the second order accuracy of the implicit time integration. Chemical source term is calculated by Jachimowski’s detailed reaction mechanism of hydrogen/air combustion, which has been widely used for the simulation of SIC successfully.
2.2 Dynamic Mode Decomposition
Dynamic mode decomposition is a method to extract linear fluctuations from instantaneous fields of data set collected by the same time interval[6,7]. The instantaneous fields, i.e., i-th snapshots, vi, are stored in matrices, Vm and Vm+1 as shown below:
| (2) |
A theoretical matrix, A, bonds nonlinearly the snapshots with each other by the following equation:
| (3) |
The single value decomposition[8] is performed within the algorithm for approximate computation of the matrix A. The details on procedures to get the matrix A can be found in literature[9].
Then, the final equation is derived as follows.
| (4) |
where λi and Ei are the i-th eigenvalue and pseudo-eigenvector of the approximate matrix of A, respectively. Damping coefficient is introduced as a quantitative parameter for acoustic damping in this analysis.
The damping coefficient for each resonant mode is calculated by Eq. 5 and 6
| (5) |
| (6) |
where Δt is the time step and Nstep is the number of time step. The symbol, T, denotes the period of its acoustic oscillation. A negative damping coefficient, ξi, means that the resonant mode decays in amplitude. Conversely, ξi with a positive value means that the resonant mode grows in amplitude, leading to unstable mode[10].
2.3 Experimental and Computational Conditions
Among the various experimental cases of SIC by Lehr, three case of Mach numbers 4.18, 4.48, and 4.79 show the regularly oscillating SIC at corresponding frequencies of 148, 425, and 712 kHz, respectively. In the present study, the intermediate case of Mach number 4.48 for stoichiometric hydrogen–air mixture at 320 mmHg and 293 K was considered, since this case exhibits measurable induction distance and good number of waves within the domain of computational consideration.
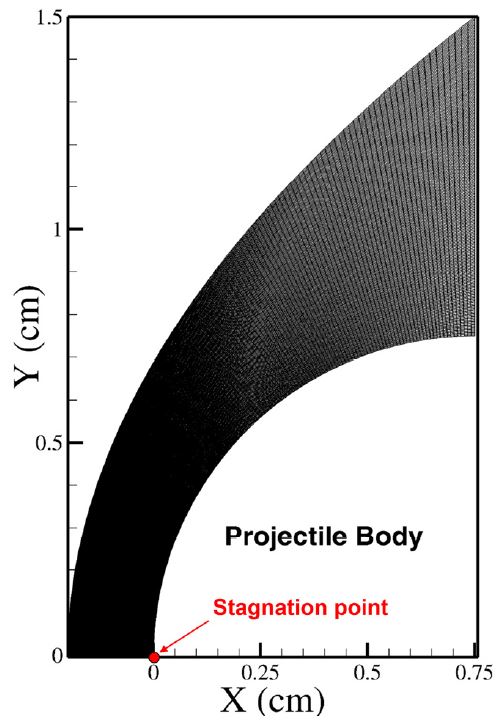
The diameter of the hemispherical projectile used in the experiment is 15 mm. Fig. 1 is the computational grid used for the numerical simulation. Grid space is equally distributed in tangential and normal directions. Four levels of grids are considered in this study. Normal grid space along the stagnation stream line ranges from 13.5 μm for the coarsest grid, Grid 1 to 2.4 μm for the finest grid, Grid 4.
Periodicity of the flow is quantified by monitoring the temporal variation of pressure and temperature along the stagnation stream line and point. Frequency of oscillation was calculated by the Fast-Fourier Transform (FFT) analysis of the temporal variation of stagnation pressure. The stagnation pressure is monitored at the stagnation point as shown in Fig. 1.
3. Results and discussion
3.1 Results of Unsteady Numerical Simulation
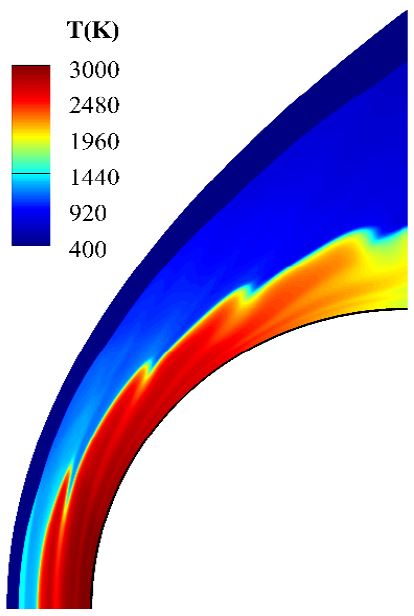
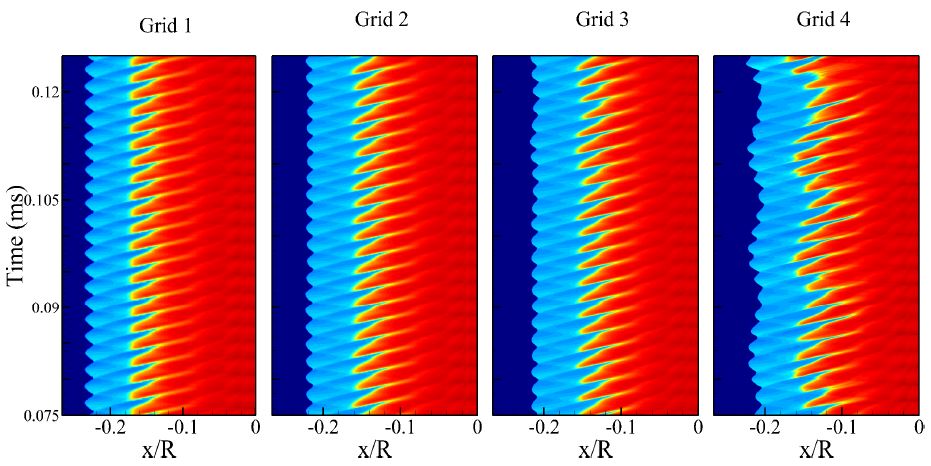
Fig. 2 is the temperature distribution in the computational domain for Grid 2 clearly representing the regularly oscillating unsteady SIC. For the comparison of oscillatory characteristics depending on the grid r esolution, x-t diagram was plotted in Fig. 3 for temperature variation along the stagnation for the four different grids. As in the figure, the nature of the regular oscillation was captured well in all grid levels. The locations of shock wave and flame front agree well with each other except for the finest grid where the oscillation develops a low frequency oscillation overlaid with the regular oscillation.
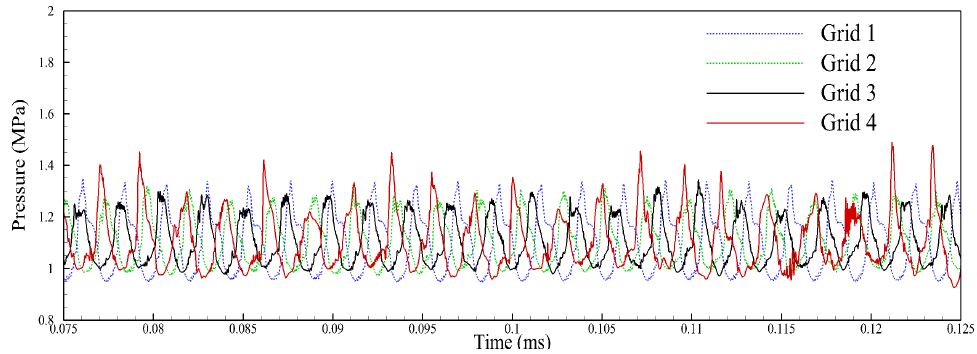
However, the low frequency was not observed experimentally nor in the solutions by lower resolution grids. Pressure history at stagnation point also shows that the oscillation is disturbed by the increase in grid resolution, as shown in Fig. 4. Flow develops a low frequency oscillation that can be seen from the intermittent peaks for Grid 4. The presence of low frequency oscillation may be attributed to the amplification of numerical errors caused by the fine resolution. However, it is contradictory to the common sense of grid convergence, but should be investigated further for better understanding.
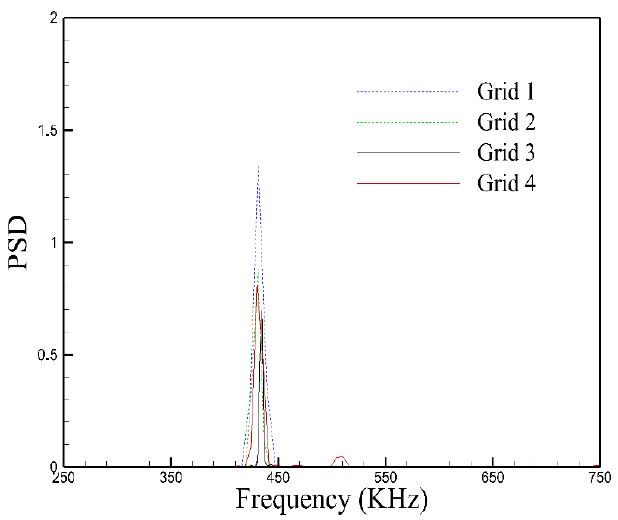
In Fig. 5, FFT spectrum of pressure signals reveal that almost all the grid systems oscillate at frequencies around 430-435 kHz and the measured one was around 425 kHz from the experiments. However, lower frequency oscillations than 400 kHz were not observed in the FFT results. This is because time duration for monitoring of pressure signals is too short to resolve low frequency oscillations or PSD (power spectral density) of the oscillations is negligibly small. However, low frequency oscillations are to be pursued in terms of combustion instabilities. For this purpose, an alternative method to the conventional FFT is required. Dynamic mode decomposition method, a post processing tool to investigate such oscillations would be feasible in this situation.
3.2 Results and Discussions on DMD Analysis
As aforementioned, Dynamic mode decomposition method is applied to see whether low frequency oscillations are existent or not. DMD analysis is performed only with the system of Grid 4 because it has the finest grids and has low frequency oscillations from the results shown in Fig. 3 and 4.
By applying DMD, several frequencies are calculated and they range from 140 to 700 kHz as listed in Table 1. Although not shown here, DMD results showed that the frequencies between 425 and 438 kHz are found as well for all the kinds of grids.
With the Grid 4, the noticeable frequency was calculated 425.5 kHz and the error between numerical and measured ones is only 0.1%. It means that the DMD method may be a more accurate post processing tool than FFT. Damping coefficients for each resonant mode are also calculated to quantify the instability and shown in Table 1. The oscillating frequencies and their damping factors are simultaneously by applying DMD. It is another advantage of this method, DMD.
Damping coefficients of all of 9 resonant modes identified here are negative. In the aspect of combustion instability, it implies that the current shock-induced combustion is stable. That is, pressure oscillations induced by SIC do not grow up as time goes on. Pressure oscillations shown in Fig. 4 will be stabilized finally.
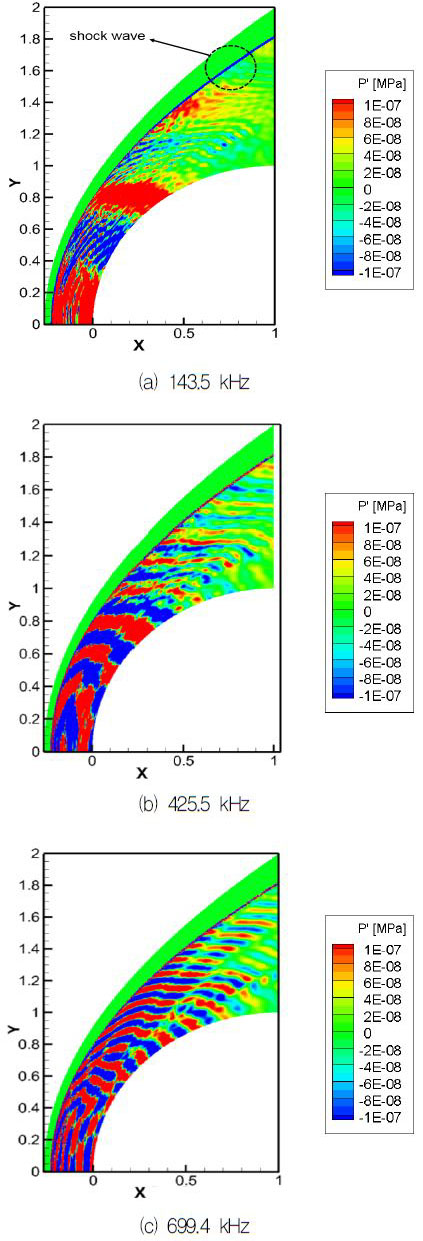
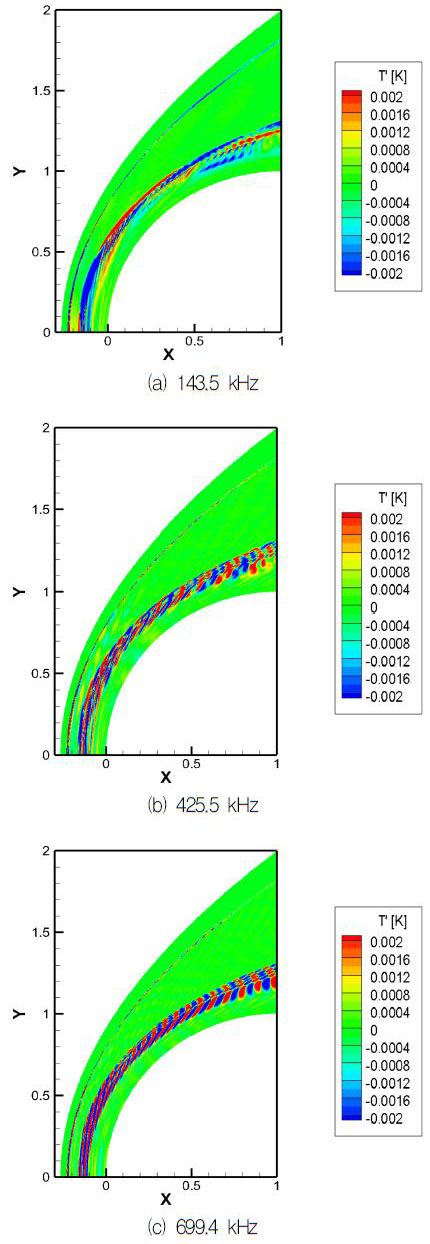
The pressure fields with the three monochromatic signals of 143.5, 425.5, and 700 kHz, respectively, are shown in Fig. 6, which can be extracted by applying DMD. At the stagnation point with (x, y) = (0, 0), the pressure fluctuation is stronger than in the other zones. This is the characteristics well known in shock-induced combustion. Temperature fluctuation fields also have similar tendency to pressure ones as can be seen in Fig. 7. Along the shock wave, thin temperature fluctuation is generated and broader fluctuation zones are formed downstream.
From the results of DMD application, we can obtain the resonant modes, their frequencies, their damping coefficients, and monochromatic fluctuation fields with a particular frequency. Application of DMD for combustion instability prediction is feasible and it can be an alternative to the conventional FFT analysis.
4. Conclusions
The numerical work on shock induced combustion is conducted. Numerical simulations are performed with four kinds of grid system. The resonant frequencies of 430-435 KHz were identified as dominant ones and the measured frequency was around 425 kHz. To overcome short duration time for monitoring of pressure signals, dynamic mode decomposition is applied and lower frequency modes can be identified in addition to already known frequencies. Their frequencies range from 140 kHz to 700 kHz and the error compared with experiments is only 0.1%. And, damping coefficients were calculated for the 9 frequencies identified in this shock-induced combustion field. They were negative, which implies that all the modes identified are stable. From the results, it is found that DMD is a useful post-processing tool to determine resonant modes over the wide range of frequency and can be an alternative to the conventional method such as FFT analysis in order to predict unstable modes.
Acknowledgments
This work was supported by Advanced Research Center Program (NRF-2013R1A5A1073861) through the National Research Foundation of Korea (NRF) grant funded by the Korea government (MSIP) contracted through Advanced Space Propulsion Research Center at Seoul National University.
References
- Lehr, H.F., “Experiments on Shock-induced Combustion”, Astronautica Acta, 17, p589-597, (1972).
-
McVey, J.B., and Toong, T.Y., “Mechanism of Instabilities of Exothermic Hypersonic Blunt-body Flows”, Combustion Science and Technology, 3(2), p63-76, (1971).
[https://doi.org/10.1080/00102207108952273]

-
Matsuo, A., and Fujiwara, T., “Numerical Investigation of Oscillatory Instability in Shock-induced Combustion around a Blunt Body”, AIAA Journal, 31(10), p1835-1841, (1993).
[https://doi.org/10.2514/3.11856]

-
Choi, J.Y., Jeung, I.S., and Yoon, Y., “Computational Fluid Dynamics Algorithms for Unsteady Shock-induced Combustion, Part 1: Validation”, AIAA Journal, 38(7), p1179-1187, (2000).
[https://doi.org/10.2514/2.1112]

-
Choi, J.Y., Jeung, I.S., and Yoon, Y., “Computational Fluid Dynamics Algorithms for Unsteady Shock-induced Combustion, Part 2: Comparison”, AIAA Journal, 38(7), p1188-1195, (2000).
[https://doi.org/10.2514/2.1087]

-
Chen, K.K., Tu, J.H., and Rowley, C.W., “Variants of Dynamic Mode Decomposition: Boundary Condition, Koopman, and Fourier Analyses”, Journal of nonlinear science, 22(6), p887-915, (2012).
[https://doi.org/10.1007/s00332-012-9130-9]

-
Schmid, P.J., “Dynamic Mode Decomposition of Numerical and Experimental Data”, Journal of Fluid Mechanics, 656, p5-28, (2010).
[https://doi.org/10.1017/s0022112010001217]

-
Golub, G., and Kahan, W., “Calculating the Singular Values and Pseudo-inverse of a Matrix”, Journal of the Society for Industrial and Applied Mathematics, Series B: Numerical Analysis, 2(2), p205-224, (1965).
[https://doi.org/10.1137/0702016]

-
Sohn, C.H., Park, I.S., Kim, S.K., and Kim, H.J., “Acoustic Tuning of Gas-liquid Scheme Injectors for Acoustic Damping in a Combustion Chamber of a Liquid Rocket Engine”, Journal of sound and vibration, 304(3), p793-810, (2007).
[https://doi.org/10.1016/j.jsv.2007.03.036]

-
Jourdain, G., and Eriksson, L.E., “Numerical Comparison between the Dynamic Mode Decomposition and the Arnoldi Extraction Technique on an Afterburner Test Case”, In 18th AIAA/CEAS Aeroacoustis Conference, Colorado Springs, C.O., U.S.A, Jun. 2012.
[https://doi.org/10.2514/6.2012-2147]

